Configures Xdebug's log file.
Xdebug will log to this file all file creations issues, Step Debugging
connection attempts, failures, and debug communication.
Enable this functionality by setting the value to a absolute path. Make sure
that the system user that PHP runs at (such as www-data if you are
running with Apache) can create and write to the file.
The file is opened in append-mode,
and will therefore not be overwritten by default. There is no concurrency
protection available.
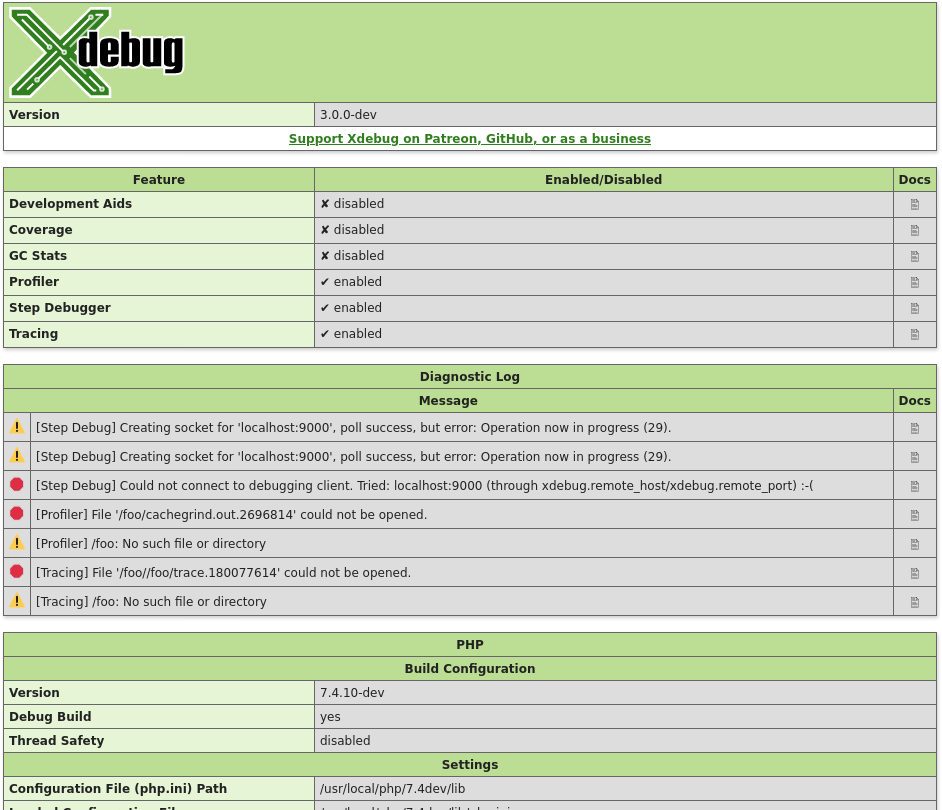
The log file will include any attempt that Xdebug
makes to connect to an IDE:
[2693358] Log opened at 2020-09-02 07:19:09.616195
[2693358] [Step Debug] INFO: Connecting to configured address/port: localhost:9003.
[2693358] [Step Debug] ERR: Could not connect to debugging client. Tried: localhost:9003 (through xdebug.client_host/xdebug.client_port).
[2693358] [Profiler] ERR: File '/foo/cachegrind.out.2693358' could not be opened.
[2693358] [Profiler] WARN: /foo: No such file or directory
[2693358] [Tracing] ERR: File '/foo/trace.1485761369' could not be opened.
[2693358] [Tracing] WARN: /foo: No such file or directory
[2693358] Log closed at 2020-09-02 07:19:09.617510
It includes the opening time (2020-09-02 07:19:09.616195), the
IP/Hostname and port Xdebug is trying to connect to
(localhost:9003), and whether it succeeded (Connected to
client). The number in brackets ([2693358]) is the
Process ID.
It includes:
[2693358]- process ID in brackets
2020-09-02 07:19:09.616195- opening time
-
For Step Debugging:
INFO: Connecting to configured address/port: localhost:9003.
ERR: Could not connect to debugging client. Tried: localhost:9003 (through xdebug.client_host/xdebug.client_port).
For Profiling:
ERR: File '/foo/cachegrind.out.2693358' could not be opened.
WARN: /foo: No such file or directory
For Function Trace and Flame Graphs:
ERR: File '/foo/trace.1485761369' could not be opened.
WARN: /foo: No such file or directory
All warnings and errors are described on the Description of errors page, with
detailed instructions on how to resolve the problem, if possible. All errors are always logged through
PHP's internal logging mechanism (configured with error_log
in php.ini). All warnings and errors also show up in the
diagnostics log that you can view by calling xdebug_info().
Step Debugger Communication
The debugging log can also log the communication between Xdebug and an IDE.
This communication is in XML, and starts with the <init XML
element:
<init
    xmlns="urn:debugger_protocol_v1" xmlns:xdebug="https://xdebug.org/dbgp/xdebug"
    fileuri="file:///home/httpd/www.xdebug.org/html/router.php"
    language="PHP" xdebug:language_version="7.4.11-dev"
    protocol_version="1.0" appid="2693358" idekey="XDEBUG_ECLIPSE">
        <engine version="3.0.0-dev"><![CDATA[Xdebug]]></engine>
        <author><![CDATA[Derick Rethans]]></author>
        <url><![CDATA[https://xdebug.org]]></url>
        <copyright><![CDATA[Copyright (c) 2002-2020 by Derick Rethans]]></copyright>
</init>
The fileuri attribute lists the entry point of your
application, which can be useful to compare to breakpoint_set
commands to see if path mappings are set-up correctly.
Beyond the <init element, you will find the configuration of
features:
<- feature_set -i 4 -n extended_properties -v 1
-> <response
       xmlns="urn:debugger_protocol_v1" xmlns:xdebug="https://xdebug.org/dbgp/xdebug"
       command="feature_set" transaction_id="4" feature="extended_properties" success="1">
   </response>
And continuation commands:
<- step_into -i 9
-> <response
       xmlns="urn:debugger_protocol_v1" xmlns:xdebug="https://xdebug.org/dbgp/xdebug"
       command="step_into" transaction_id="9"
       status="break" reason="ok">
           <xdebug:message filename="file:///home/httpd/www.xdebug.org/html/router.php" lineno="3">
           </xdebug:message>
   </response>
You can read about DBGP - A common debugger protocol specification at its dedicated documation page.
The xdebug.log_level setting controls how much information is
logged.
Many Linux distributions now use systemd, which
implements private tmp directories. This means that when PHP
is run through a web server or as PHP-FPM, the /tmp directory is
prefixed with something akin to:
/tmp/systemd-private-ea3cfa882b4e478993e1994033fc5feb-apache.service-FfWZRg
This setting can additionally be configured through the
XDEBUG_CONFIG
environment variable.
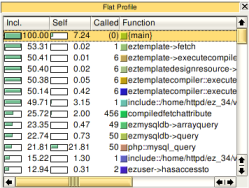 The second column "Self" shows the time spent in this function (without its
children), the third column "Called" shows how often a specific function was
called and the last column "Function" shows the name of the function. Xdebug
changes internal PHP function names by prefixing the function name with
"php::" and include files are handled in a special way too. Calls to include
(and include_once, require and require_once) are followed by "::" and the
filename of the included file. In the screenshot on the left you can see this
for "include::/home/httpd/ez_34/v..." and an example of an internal PHP
function is "php::mysql_query".
The second column "Self" shows the time spent in this function (without its
children), the third column "Called" shows how often a specific function was
called and the last column "Function" shows the name of the function. Xdebug
changes internal PHP function names by prefixing the function name with
"php::" and include files are handled in a special way too. Calls to include
(and include_once, require and require_once) are followed by "::" and the
filename of the included file. In the screenshot on the left you can see this
for "include::/home/httpd/ez_34/v..." and an example of an internal PHP
function is "php::mysql_query".
 The numbers in the first two columns can be
either percentages of the full running time of the script (like in the
example) or absolute time (1 unit is 1/1.000.000th of a second). You can
switch between the two modes with the button you see on the right.
The numbers in the first two columns can be
either percentages of the full running time of the script (like in the
example) or absolute time (1 unit is 1/1.000.000th of a second). You can
switch between the two modes with the button you see on the right.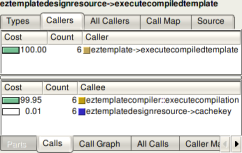 The lower pane shows information about the functions that the current selected
function called.
The lower pane shows information about the functions that the current selected
function called.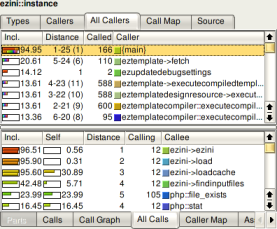 which the function was called respectively all directly made
function calls but also function calls made more levels up and down.
The upper pane in the screenshot on the left shows all functions calling the
current selected one, both directly and indirectly with other functions
inbetween them on the stack. The "Distance" column shows how many function
calls are between the listed and the current selected one (-1). If there are
different distances between two functions, it is shown as a range (for example
"5-24"). The number in parentheses is the median distance. The lower pane is
similar except that it shows information on functions called from the current
selected one, again either direct or indirect.
which the function was called respectively all directly made
function calls but also function calls made more levels up and down.
The upper pane in the screenshot on the left shows all functions calling the
current selected one, both directly and indirectly with other functions
inbetween them on the stack. The "Distance" column shows how many function
calls are between the listed and the current selected one (-1). If there are
different distances between two functions, it is shown as a range (for example
"5-24"). The number in parentheses is the median distance. The lower pane is
similar except that it shows information on functions called from the current
selected one, again either direct or indirect. Profiling with Xdebug in Docker