Xdebug's step debugger allows you to interactively walk through your code to
debug control flow and examine data structures.
Introduction #
Xdebug interacts with IDEs to provide step debugging functionality, and
therefore you also need to configure an IDE that knows how to talk to Xdebug
with the open DBGp protocol.
This protocol is supported by nearly every PHP IDE (including Visual Studio
Code and PhpStorm), and also by text-based editors. There is
also a simple Command Line Debug Client available as part of the Xdebug project,
but it is strongly recommended that you use an IDE for debugging.
An overview of third party clients is available
further down this page.
Configuring Step Debugging #
In your php.ini, 99-xdebug.ini, or other
distribution specific PHP ini file, change (or set) the xdebug.mode setting to
debug. Please refer to Configure PHP in the documentation to
find out which PHP ini file to modify.
In set-ups where PHP/Xdebug and your IDE all run on the
same host, this is all you need to configure on the PHP and Xdebug side.
(Skip to Activating the Debugger if
that's the case.)
If PHP/Xdebug run on a different machine than your IDE, or in a Docker
container, then you need to tell Xdebug where to make the debugging connection
to, as it is Xdebug that initiates the communication to the IDE, and not
the other way around.
If PHP/Xdebug run on a different machine than your IDE in the same sub-net,
and you run your browser on the same host as your IDE, then you set the
xdebug.discover_client_host setting to 1. Xdebug will then use the
HTTP headers to find out the IP address of the host that initiated the
debugging request, and use that IP address to connect to. This set up is common
among multiple developers working in the same office.

Xdebug Cloud is a
Proxy-as-a-Service, which can help you with complexities with regards
to networking. A common use case is having multiple developers, who
share a common development server on private network, while working in
a remote location.
» Xdebug Cloud Website
In more complex set-ups you need to configure the host and port that Xdebug
connects to yourself. With xdebug.client_host you can select the IP or hostname
of the machine that runs your IDE, and with xdebug.client_port the TCP port.
Make sure that the host running PHP/Xdebug can connect to your IDE with the
configured IP address and port, and that there is no firewall or other software
blocking an incoming connection.
If it is not possible for Xdebug to make a direct connection to the IDE due
to networking or a firewall, then you can only use the Xdebug Cloud service. This
acts like a relay between Xdebug and your IDE so that you can succesfully
initiate a debug session.
Activating Step Debugging #
In the default configuration, the debugger activates if a "trigger" is
present, although it's possible to instruct the debugger to always initiate a
debugging session by setting xdebug.start_with_request to yes.
Which trigger to use depends on whether you're debugging a PHP application
through a browser, or on the command line, such as when running unit tests.
Command Line #
To signal the debugger to initiate connections, Xdebug will look whether the
XDEBUG_SESSION environment variable is present.
The value
of the variable does not matter unless you have set up a trigger value with
xdebug.trigger_value.
On Unix like platforms, you can set it like:
export XDEBUG_SESSION=1
On Windows, you set the environment like:
set XDEBUG_SESSION=1
When you now run a php script with php myscript.php or
vendor/bin/phpunit Xdebug will initiate a debugging session and
connect to your IDE.
Please refer to the Troubleshooting section if
it does not seem like Xdebug is activating.
Web Application #
The recommended way to initiate a debugging session is by configuring your
IDE to accept incoming debugging connections, and then use a browser extension
which sets the right trigger cookie.
Browser Extension Initiation #
The extensions are:
Each extension adds an icon to your browser where you can select which
functionality you want to trigger. Xdebug will continue to start debugging for
every request as long as the debug toggle has been enabled.
Manual Initiation #
Alternatively, you can signal Xdebug to initiate debugging for a
single request by adding
XDEBUG_SESSION=session_name as additional GET (or
POST) parameter. You can pick any value for
session_name, unless xdebug.trigger_value is set.
For debugging multiple subsequent requests, Xdebug supports
debugging sessions managed by a cookie.
Set the XDEBUG_SESSION_START=session_name GET (or
POST) HTTP parameter.
Xdebug will set the XDEBUG_SESSION cookie. As long as the
cookie is present, debugging will be initiated for every HTTP request
(including favicons and images if they go through PHP).
Before Xdebug 3.1, the time-out of the cookie is one hour. Starting with
Xdebug 3.1, the cookie has no time-out configured.
If you set the XDEBUG_SESSION_STOP GET (or
POST) HTTP parameter, Xdebug removes the cookie.
HTTP Cookie #
Xdebug will initiate a debug session in the presence of the
XDEBUG_SESSION HTTP cookie. You can pick any value for the cookie,
unless xdebug.trigger_value is set, in which case the value needs to match the
value/one of the values from xdebug.trigger_value.
A typical header looks like:
Cookie: XDEBUG_SESSION=start
Alternative Ways of Triggering the Debugger #
There are other ways how debugger activation can be triggered.
By Calling xdebug_break()
Calling xdebug_break() will trigger a debugging connection as long as
xdebug.start_with_request is set to trigger and no debugger session
is active yet. If a debugger session is already active, it will simply act as
if a breakpoint was set through your IDE.
Upon an Error Situation
If you set xdebug.start_upon_error to yes then Xdebug will
trigger a debugging connection when a PHP Notice or Warning appears, or when a
Throwable
(Error or Exception) is thrown.
Ignoring a Request to Trigger the Debugger #
In some situations, it might be necessary to prevent Xdebug from initiating
a debug session, even if any of the triggers (such as the
XDEBUG_SESSION cookie) is present. For example when your application is making
an XHR request from a debug toolbar.
In this situation you can set XDEBUG_IGNORE as cookie, GET, or
POST variable to any value besides no or 0. If Xdebug
detects its presence with any other value, it will not start a debug
connection, but also not modify or remove an existing
XDEBUG_SESSION cookie.
Troubleshooting #
You can troubleshoot Xdebug's attempts at initiating debugging connections
by configuring a log file through xdebug.log. When the connection is
successfully established the log will also contain the communication between
Xdebug and IDE.
The log file will contain to which IP addresses it is attempting to connect
and at which ports, which should be a great help debugging why it sometimes
doesn't work. A "remote log file" is also required when reporting a bug in
Xdebug's step debugger.
There are several logging levels which can be configured through
xdebug.log_level.
The xdebug.log setting requires as argument a full path to a file, to
which the user that PHP/Xdebug runs as can write to. It is advisable to use
something like /tmp/xdebug.log.
Be aware: On many Linux distributions that run services through
Systemd, the actual file path could be different, such as:
/tmp/systemd-private-80b2a71a8b9843c0b7c21b0d357e59cc-apache2.service-CN4RBr/xdebug.log
Debugging Clients #
This is an incomplete list of third-party clients, both free and commercial.
Please refer to the original authors of these tools for documentation and
support:
The simple command line client dbgpClient for debugging is
available on the download page.
Implementation Details #
This section documents some implementation details, that are mostly useful
for authors of debugging clients that interact with Xdebug.
DBGp: context_names
Xdebug's implementation of the
DBGp protocol's context_names
command does not depend on the stack level. The returned value is always the
same during each debugger session, and hence, can be safely cached.
Custom DBGp commands
The DBGp protocol allows for debugger engine specific commands, prefixed with
the xcmd_ prefix. Xdebug includes a few of these, and they're
documented here.
DBGp: xcmd_profiler_name_get
If Xdebug's profiler is currently active (See: Profiling), this command
returns the name of the file that is being used to write the profiling
information to.
DBGp: xcmd_get_executable_lines
This command returns which lines in an active stack frame can have a working
breakpoint. These are the lines which have an EXT_STMT
opcode on them. This commands accepts a -d option, which
indicates the stack depth, with 0 being the top level stack frame.
The command returns the information in the following XML format:
<?xml version="1.0" encoding="iso-8859-1"?>
<response
  xmlns="urn:debugger_protocol_v1"
  xmlns:xdebug="https://xdebug.org/dbgp/xdebug"
  command="xcmd_get_executable_lines"
  transaction_id="10">
	<xdebug:lines>
		<xdebug:line lineno="2"></xdebug:line>
		<xdebug:line lineno="3"></xdebug:line>
		<xdebug:line lineno="4"></xdebug:line>
		<xdebug:line lineno="6"></xdebug:line>
		<xdebug:line lineno="8"></xdebug:line>
	</xdebug:lines>
</response>
Related Content #
 Debugging Symfony Console Commands
This video explains how to debug Symfony Console Commands on the CLI with PhpStorm
- Debugging with VIM and Vdebug
In this video I show how I installed vdebug for VIM, to be able to step debug through the Xdebug website, all on the command line.
- Laravel Sail with PhpStorm
This video shows how to enable and set-up Xdebug within the Laravel Sail Docker environment.
- Setting up Apache, PHP, VS Code, and Xdebug in 10 minutes
This video shows you how to install Apache, PHP, VS Code, and Xdebug on Ubuntu 21.10, to get a PHP development set-up, all within 10 minutes.
- Short Closures and Conditional Breakpoints
This short video shows how useful Xdebug is with short closures, and also introduce some basic conditional breakpoints.
- Start Upon an Error
In this video we're going to have a look at one of Xdebug's lesser known and used features: starting a debugging request only when an error happens.
- Step Debugging Unit Tests with PhpStorm on Linux
This video explains how to install Xdebug on the Linux command line through PECL, and then shows how to find and fix bugs when running unit tests with PHPUnit.
- Step Debugging with Docker and PhpStorm
This video explains in a few minutes how to set-up debugging with PHP and Xdebug running in Docker and PhpStorm.
- Step Debugging with Docker and VS Code
This video explains how to dockerify the Symfony Demo Application, and then setup debugging with Xdebug and VS Code.
Related Settings and Functions #
Settings #
string xdebug.client_discovery_header = "HTTP_X_FORWARDED_FOR,REMOTE_ADDR" #
If xdebug.client_discovery_header is configured to be a non-empty string, then the
value is used as key in the $_SERVER superglobal array to determine
which header to use to find the IP address or hostname to use for 'connecting
back to'. This setting is only used in combination with
xdebug.discover_client_host and is otherwise ignored.
For example, if xdebug.client_discovery_header is set to
HTTP_FORWARD_HOST, then Xdebug will check
$_SERVER['HTTP_FORWARD_HOST'] to obtain the IP address to use for
'connecting back'.
It is possible to configure multiple fallbacks by using a comma separated
list of values. For example if you want to use HTTP_FORWARD_HOST
first, and then also want to check REMOTE_ADDR, then you set
xdebug.client_discovery_header to
HTTP_FORWARD_HOST,REMOTE_ADDR.
PHP automatically prepends HTTP_, and converts
- to _, for received HTTP header names. The
THIS-IS-MY-HOST HTTP header is converted into
$_SERVER['HTTP_THIS_IS_MY_HOST']. Therefore, the
xdebug.client_discovery_header needs to be set to
HTTP_THIS_IS_MY_HOST to match this.
If you have logging enabled, and set the xdebug.log_level setting to
10, then Xdebug will list every header, the header value, and the
used header (if any) when attempting to find the IP address to connect back
to.
Xdebug 3.2 and later no longer fall back to the
$_SERVER['HTTP_X_FORWARDED_FOR'] and
$_SERVER['REMOTE_ADDR'] header values by default. If you want
these headers to be used as well, you specifically need to add these to the
list of headers, by setting xdebug.client_discovery_header to
YOUR_OWN_HEADER,HTTP_X_FORWARDED_FOR,REMOTE_ADDR.
string xdebug.client_host = localhost #
Configures the IP address or hostname where Xdebug will attempt to connect to when initiating a
debugging connection. This address should be the address of the machine where your IDE or debugging
client is listening for incoming debugging connections.
Xdebug also supports a few other ways of specifying the host to connect to,
but these methods are not always available. xdebug_info() shows whether
the xdebug://* methods are available.
xdebug://gateway-
Use the system defined network gateway.
Supported on Linux only.
xdebug://nameserver-
Use the system defined private network nameserver.
Supported on Linux only, and not with distributions that use musl libc, such as Alpine
Linux.
unix:///path/to/sock-
A Unix
domain socket.
Supported on non-Windows platforms, and only supported by select
few debugging clients.
If xdebug.discover_client_host is enabled then Xdebug will only use the value of this setting in
case Xdebug can not connect to an IDE using the information it obtained from HTTP headers. In that
case, the value of this setting acts as a fallback only.
This setting can additionally be configured through the
XDEBUG_CONFIG
environment variable.
integer xdebug.client_port = 9003 #
The port to which Xdebug tries to connect on the remote host. Port
9003 is the default for both Xdebug and the Command Line Debug Client.
As many clients use this port number, it is best to leave this setting
unchanged.
This setting can additionally be configured through the
XDEBUG_CONFIG
environment variable.
string xdebug.cloud_id = #
With this setting you configure Xdebug for use with Xdebug Cloud. It needs to match one of the
tokens from your profile
page.
Your IDE needs to be configured with the same token for Xdebug and your IDE to
communicate through Xdebug Cloud.
In PhpStorm you can find this setting under:
File | Settings | PHP | Debug | Xdebug Cloud for Windows and Linux
PhpStorm | Preferences | PHP | Debug | Xdebug Cloud for macOS
integer xdebug.connect_timeout_ms = 200 #
The amount of time in milliseconds that Xdebug will wait for on an
IDE to acknowledge an incoming debugging connection. The default value of 200
ms should in most cases be enough. In case you often get dropped debugging
requests, perhaps because you have a high latency network, or a development box
far away from your IDE, or have a slow firewall, then you can should increase
this value.
Please note that increasing this value might mean that your requests seem to
'hang' in case Xdebug tries to establish a connection, but your IDE is not
listening.
string xdebug.control_socket = "default" #
Introduced in Xdebug >= 3.3
Linux and Windows only.
When set to "default" (the default value) or
"time", then Xdebug will poll an anonymous pipe (Linux) or Named
Pipe (Windows) every 25 ms for a command.
A command can currently be used to:
- request process information (time, memory usage, and entry file)
- initiate a debugging session by (trying to) connect to the IDE
- force a breakpoint
You should use the Xdebug Control tool to interact with this control
socket.
When this setting is set to "off", then Xdebug will not create
a control socket, and hence you can't send commands to it.
If your system (or container) does not have a reliable TSC clock, then
"default" does not enable control sockets. You have to
change this setting to "time" instead.
This is to prevent slowing down PHP by wasting time to check the current time
through a slow clock interface.
If Xdebug detects that the TSC clock is not available, it will print a warning
in the log file.
You can find out which clock source Xdebug has detected in xdebug_info()
output.
You can programatically check whether control sockets are enabled for your PHP
build by calling xdebug_info() with extension-flags as
category. If control sockets are available, then control-socket is
returned in the resulting array. If a TSC clock is available, then
tsc is also present in the resulting array.
boolean xdebug.discover_client_host = false #
If enabled, Xdebug will first try to connect to the client that made the
HTTP request. It checks the $_SERVER['HTTP_X_FORWARDED_FOR'] and
$_SERVER['REMOTE_ADDR'] variables to find out which hostname or IP
address to use.
If xdebug.client_discovery_header is configured, then the $_SERVER
variable with that configured name will be checked instead of the default variables.
If Xdebug can not connect to a debugging client as found in one of the HTTP
headers, it will fall back to the hostname or IP address as configured by the
xdebug.client_host setting.
This setting does not apply for debugging through the CLI, as the
$_SERVER header variables are not available there.
This setting can additionally be configured through the
XDEBUG_CONFIG
environment variable.
Please note that there is no filter
available, and anybody who can connect to the webserver will then be able to
start a debugging session, even if their address does not match
xdebug.client_host.
string xdebug.idekey = *complex* #
Controls which IDE Key Xdebug should pass on to the debugging client or
proxy. The IDE Key is only important for use with the DBGp Proxy Tool,
although some IDEs are incorrectly picky as to what its value is.
The default is based on the DBGP_IDEKEY environment setting. If
it is not present, the default falls back to an empty string.
If this setting is set to a non-empty string, it selects its value over
DBGP_IDEKEY environment variable as default value.
The internal IDE Key also gets updated through debugging session management
and overrides the value of this setting as is explained in the
Step Debugging documentation.
This setting can additionally be configured through the
XDEBUG_CONFIG
environment variable.
string xdebug.log = #
Configures Xdebug's log file.
Xdebug will log to this file all file creations issues, Step Debugging
connection attempts, failures, and debug communication.
Enable this functionality by setting the value to a absolute path. Make sure
that the system user that PHP runs at (such as www-data if you are
running with Apache) can create and write to the file.
The file is opened in append-mode,
and will therefore not be overwritten by default. There is no concurrency
protection available.
The log file will include any attempt that Xdebug
makes to connect to an IDE:
[2693358] Log opened at 2020-09-02 07:19:09.616195
[2693358] [Step Debug] INFO: Connecting to configured address/port: localhost:9003.
[2693358] [Step Debug] ERR: Could not connect to debugging client. Tried: localhost:9003 (through xdebug.client_host/xdebug.client_port).
[2693358] [Profiler] ERR: File '/foo/cachegrind.out.2693358' could not be opened.
[2693358] [Profiler] WARN: /foo: No such file or directory
[2693358] [Tracing] ERR: File '/foo/trace.1485761369' could not be opened.
[2693358] [Tracing] WARN: /foo: No such file or directory
[2693358] Log closed at 2020-09-02 07:19:09.617510
It includes the opening time (2020-09-02 07:19:09.616195), the
IP/Hostname and port Xdebug is trying to connect to
(localhost:9003), and whether it succeeded (Connected to
client). The number in brackets ([2693358]) is the
Process ID.
It includes:
[2693358]- process ID in brackets
2020-09-02 07:19:09.616195- opening time
-
For Step Debugging:
INFO: Connecting to configured address/port: localhost:9003.
ERR: Could not connect to debugging client. Tried: localhost:9003 (through xdebug.client_host/xdebug.client_port).
For Profiling:
ERR: File '/foo/cachegrind.out.2693358' could not be opened.
WARN: /foo: No such file or directory
For Function Trace and Flame Graphs:
ERR: File '/foo/trace.1485761369' could not be opened.
WARN: /foo: No such file or directory
All warnings and errors are described on the Description of errors page, with
detailed instructions on how to resolve the problem, if possible. All errors are always logged through
PHP's internal logging mechanism (configured with error_log
in php.ini). All warnings and errors also show up in the
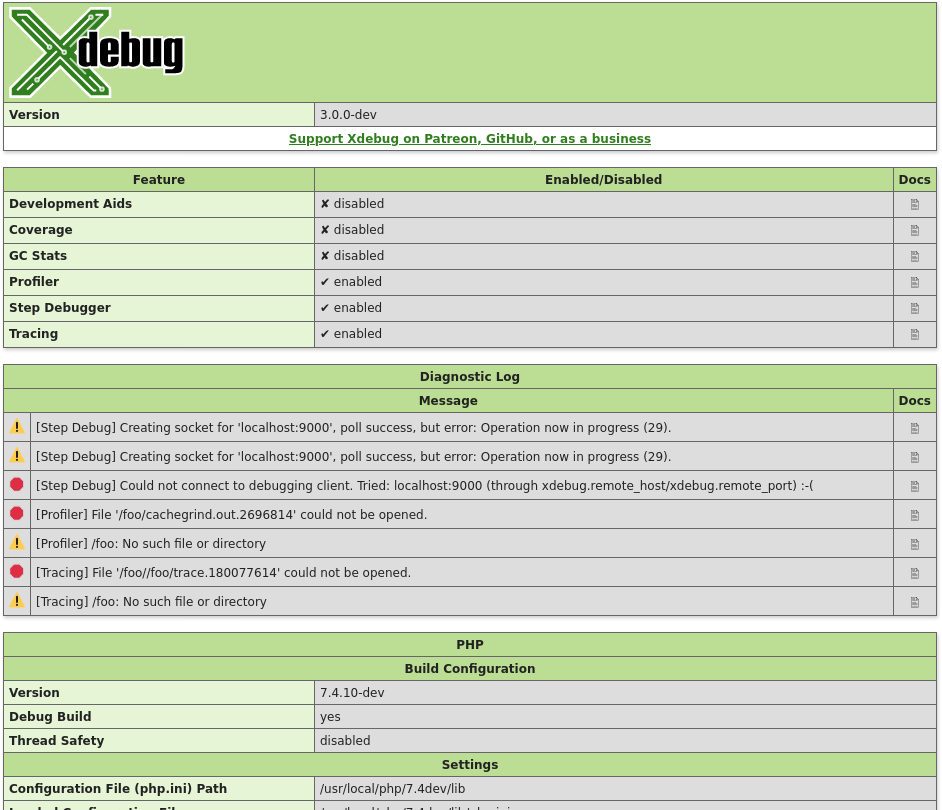
diagnostics log that you can view by calling xdebug_info().
Step Debugger Communication
The debugging log can also log the communication between Xdebug and an IDE.
This communication is in XML, and starts with the <init XML
element:
<init
    xmlns="urn:debugger_protocol_v1" xmlns:xdebug="https://xdebug.org/dbgp/xdebug"
    fileuri="file:///home/httpd/www.xdebug.org/html/router.php"
    language="PHP" xdebug:language_version="7.4.11-dev"
    protocol_version="1.0" appid="2693358" idekey="XDEBUG_ECLIPSE">
        <engine version="3.0.0-dev"><![CDATA[Xdebug]]></engine>
        <author><![CDATA[Derick Rethans]]></author>
        <url><![CDATA[https://xdebug.org]]></url>
        <copyright><![CDATA[Copyright (c) 2002-2020 by Derick Rethans]]></copyright>
</init>
The fileuri attribute lists the entry point of your
application, which can be useful to compare to breakpoint_set
commands to see if path mappings are set-up correctly.
Beyond the <init element, you will find the configuration of
features:
<- feature_set -i 4 -n extended_properties -v 1
-> <response
       xmlns="urn:debugger_protocol_v1" xmlns:xdebug="https://xdebug.org/dbgp/xdebug"
       command="feature_set" transaction_id="4" feature="extended_properties" success="1">
   </response>
And continuation commands:
<- step_into -i 9
-> <response
       xmlns="urn:debugger_protocol_v1" xmlns:xdebug="https://xdebug.org/dbgp/xdebug"
       command="step_into" transaction_id="9"
       status="break" reason="ok">
           <xdebug:message filename="file:///home/httpd/www.xdebug.org/html/router.php" lineno="3">
           </xdebug:message>
   </response>
You can read about DBGP - A common debugger protocol specification at its dedicated documation page.
The xdebug.log_level setting controls how much information is
logged.
Many Linux distributions now use systemd, which
implements private tmp directories. This means that when PHP
is run through a web server or as PHP-FPM, the /tmp directory is
prefixed with something akin to:
/tmp/systemd-private-ea3cfa882b4e478993e1994033fc5feb-apache.service-FfWZRg
This setting can additionally be configured through the
XDEBUG_CONFIG
environment variable.
integer xdebug.log_level = 7 #
Configures which logging messages should be added to the log file.
The log file is configured with the xdebug.log setting.
The following levels are supported:
| Level | Name | Example |
|---|
| 0 | Criticals | Errors in the configuration |
| 1 | Errors | Connection errors |
| 3 | Warnings | Connection warnings |
| 5 | Communication | Protocol messages |
| 7 | Information | Information while connecting |
| 10 | Debug | Breakpoint resolving information |
Criticals, errors, and warnings always show up in the
diagnostics log that you can view by calling xdebug_info().
Criticals and errors are additionally logged through
PHP's internal logging mechanism (configured with error_log
in php.ini).
This setting can additionally be configured through the
XDEBUG_CONFIG
environment variable.
string xdebug.mode = develop #
This setting controls which Xdebug features are enabled.
This setting can only be set in php.ini or
files like 99-xdebug.ini that are read when a PHP process starts
(directly, or through php-fpm). You can not set this value in
.htaccess and .user.ini files, which are read
per-request, nor through php_admin_value as used in Apache VHOSTs
and PHP-FPM pools.
The following values are accepted:
off- Nothing is enabled. Xdebug does no work besides checking whether
functionality is enabled. Use this setting if you want close to 0
overhead.
develop- Enables Development Helpers including the overloaded var_dump().
coverage- Enables Code Coverage Analysis to generate code coverage reports, mainly in
combination with
PHPUnit.
debug- Enables Step Debugging. This can be used to step through your code while it
is running, and analyse values of variables.
gcstats- Enables Garbage Collection Statistics to collect statistics about PHP's Garbage
Collection Mechanism.
profile- Enables Profiling, with which you can analyse performance bottlenecks
with tools like KCacheGrind.
trace- Enables the Function Trace and Flame Graphs features.
- The former allows
you record every function call, including arguments, variable assignment, and
return value that is made during a request to a file.
- The latter can be used to visualise certain performance characteristics.
You can enable multiple modes at the same time by comma separating their
identifiers as value to xdebug.mode: xdebug.mode=develop,trace.
XDEBUG_MODE environment variable
You can also set Xdebug's mode by setting the XDEBUG_MODE
environment variable on the command-line; this will take precedence over the
xdebug.mode setting, but will not change the value of the xdebug.mode
setting.
Some web servers have a configuration option to
prevent environment variables from being propagated to PHP and Xdebug.
For example, PHP-FPM has a clear_env
configuration setting that is on by default, which you will
need to turn off if you want to use XDEBUG_MODE.
Make sure that your web server does not clean the environment, or specifically
allows the XDEBUG_MODE environment variable to be passed on.
string xdebug.start_upon_error = default #
Step Debugging can be activated when a PHP Notice or Warning is emitted, or
when a Throwable
(Exception/Error) is thrown, depending on the value of this setting:
yes-
Initialise a debugging session when a PHP Notice or Warning is emitted, or
when a Throwable is thrown.
nodefault-
Do not start a debugging session upon an error situation.
This setting is independent of xdebug.start_with_request, and therefore it is
not necessary to set xdebug.start_with_request=trigger.
string xdebug.start_with_request = default #
Step Debugging, a Function Trace, Flame Graphs,
Garbage Collection Statistics, or Profiling can be
activated at the start of a PHP request. Whether this happens depends on the
value of this setting:
yes-
The functionality starts when the PHP request starts, and before any PHP
code is run.
For example xdebug.mode=trace and
xdebug.start_with_request=yes starts a Function Trace for the
whole request.
no-
The functionality does not get activated when the request starts.
You can still start a Function Trace with xdebug_start_trace(),
or Garbage Collection Statistics with xdebug_start_gcstats().
Step Debugging and Profiling will never activate with this value.
trigger-
The functionality only gets activated when a specific trigger is present
when the request starts.
The name of the trigger is XDEBUG_TRIGGER, and Xdebug checks
for its presence in either $_ENV (environment variable),
$_GET or $_POST variable, or $_COOKIE
(HTTP cookie name).
There is a legacy fallback to a functionality specific trigger name:
XDEBUG_PROFILE (for Profiling), XDEBUG_TRACE
(for a Function Trace or Flame Graphs), and XDEBUG_SESSION (for
Step Debugging).
There is another legacy trigger for Step Debugging only. If you set the
XDEBUG_CONFIG environment variable to any value, then the step
debugger will also get activated.
Debug session management for Step Debugging is also
available through XDEBUG_SESSION_START.
With xdebug.trigger_value you can control which specific trigger value will
activate the trigger. If xdebug.trigger_value is set to an empty
string, any value will be accepted.
In this mode it is also possible to activate Step Debugging with
xdebug_break().
default-
The default value depends on xdebug.mode:
- debug:
trigger
- gcstats:
no
- profile:
yes
- trace:
trigger
string xdebug.trigger_value = "" #
This setting can be used when xdebug.start_with_request is set to
trigger, which is the default for Step Debugging and Function Trace.
In trigger mode, Xdebug will only start its
functionality when the XDEBUG_TRIGGER is set in the environment,
or when the XDEBUG_TRIGGER GET, POST, or COOKIE variable is
set.
The legacy names XDEBUG_SESSION (for Step Debugging),
XDEBUG_PROFILE (for Profiling), and XDEBUG_TRACE
(for Function Trace) can also be used instead of XDEBUG_TRIGGER.
Normally, Xdebug does not look at which value is actually used. If this
setting is set to a non-empty string, then Xdebug will only trigger if the
value matches the value of this setting.
With the following settings:
xdebug.mode=profile
xdebug.start_with_request=trigger
xdebug.trigger_value=StartProfileForMe
Xdebug's profiler will only start when either the environment variable
XDEBUG_TRIGGER is set to StartProfileForMe, the GET
or POST variable XDEBUG_TRIGGER is set to
StartProfileForMe, or when the cookie XDEBUG_TRIGGER
has the value StartProfileForMe.
From Xdebug 3.1, it is possible to configure multiple values by using a
comma separated list. In that case, Xdebug will trigger if the supplied value
matches any of the entries that are configured through this setting:
xdebug.trigger_value=StartDebuggerForMe,StartDebuggerForYou
See also:
- xdebug.start_with_request#trigger
- For how the triggering mechanism works, and which environment and server variables Xdebug acts on.
Functions #
xdebug_break()
: bool
#
Emits a breakpoint to the debug client
This function makes the debugger break on the line it is called from, as if a
normal file/line breakpoint was set on this line through the debugger protocol.
If no debugging session is active yet, and xdebug.start_with_request is set to
trigger, then Xdebug will attempt to start a new debugging session
first.
The function returns true if a debugging session is (now) active,
and the breakpoint was succesfully set. It returns false if a
debugging session was not active and could not be activated.
xdebug_connect_to_client()
: bool
#
Instructs Xdebug to establish a debugging session
Introduced in version 3.1
This functions instructs Xdebug to try to establish a connection to a debugging
client.
Normally, Xdebug tries to start a debugging session at the start of the
request. If a debugging client is not listening at that point, then Xdebug does
not try to re-establish a connection during the remainder of the request.
In the situation where one long running PHP process handles multiple tasks,
perhaps from a queue, calling xdebug_connect_to_client() can then be used
to re-try to establish a connection for a specific worker job.
xdebug_info( string $category = null )
: mixed
#
Show and retrieve diagnostic information
This function presents APIs to retrieve information about Xdebug itself. Which
information gets returned, or displayed, depends on which arguments, or none at
all, are given.
$category =
Without arguments, this function returns an HTML page which shows diagnostic
information. It is analogous to PHP's phpinfo() function.
The HTML output includes which mode is active, what the settings are, and
diagnostic information in case there are problems with debugging connections,
opening of files, etc.
Each warning and error in the diagnostics log also links through to the
Description of errors documentation page.
$category = 'mode' (New in Xdebug 3.1)
The function returns an array of all the
enabled modes, whether through xdebug.mode or the
XDEBUG_MODE environment variable.
Example:
<?php
var_dump( xdebug_info( 'mode' ) );
?>
Returns:
array(3) {
  [0] =>
  string(5) "debug"
  [1] =>
  string(7) "develop"
  [2] =>
  string(5) "trace"
}
$category = 'extension-flags' (New in Xdebug 3.1)
The function returns an array of all the compile flags that were enabled when
running ./configure as part of Xdebug's compilation process, and
all the system-specific detected features that effect Xdebug's behaviour.
If the compression flag is enabled, then the xdebug.use_compression
setting is available, and enabled by default.
Profiling and Function Trace will create GZip compressed files if the
xdebug.use_compression setting is turned on (the default).
If the control-socket and tsc elements are present,
then Xdebug can be controlled with the Xdebug Control tool, as long as
xdebug.control_socket is not set to "off".
If the control-socket flag is present, but the tsc
flag is not present, then you must set xdebug.control_socket to
"time" deliberately for Xdebug Control to be able to interact
with Xdebug.
Example:
<?php
var_dump( xdebug_info( 'extension-flags' ) );
?>
Returns:
array(1) {
  [0] =>
  string(11) "compression"
  [1] =>
  string(14) "control-socket"
  [2] =>
  string(3) "tsc"
}
xdebug_is_debugger_active()
: bool
#
Returns whether a debugging session is active
Returns true if a debugging session through DBGp is currently
active with a client attached; false, if not.
xdebug_notify( mixed $data )
: bool
#
Sends data to a debugging client
Introduced in version 3.1
This function sends the contents of the $data variable over the debugging
protocol to a client.
If the step debugger mode is not active, or if there is no active debugging
session, this function returns false, otherwise true
is returned.
A debugging client needs specific support to handle these notifications.