Flame Graphs
Flame graphs are a special type of trace file that can be used to visualise performance metrics.
Those so-called "flame graphs" can be useful to find out bottlenecks in your code. Xdebug supports both "cost" flame graphs, indicating CPU run time, and "memory usage" flame graphs, which visualise memory usage. The latter are only an indication, as PHP's garbage collector can reduce memory at unpredictable points.
In Xdebug, flame graphs are implemented as a special kind of Function Trace.
Therefore you must include trace in your xdebug.mode setting
or XDEBUG_MODE environment variable.
You must also set the xdebug.trace_format setting to 3 for cost
flame graphs, or 4 for memory usage flame graphs.
After flame graph data has been generated with Xdebug, a separate tool then converts this data into an SVG file to display and use.
Although it is possible to do partial flame graphs by using xdebug_start_trace() and xdebug_stop_trace(), but this is not advised. It is best to create a flame graph for the whole request by having it trigger when the request starts.
Configure for Flame Graph Generation #
To make a flame graph, you first need to use Xdebug to generate data. The following settings are required:
xdebug.mode=trace      // or xdebug.mode=trace,develop
xdebug.trace_format=3  // or xdebug.trace_format=4 for memory graphs
Because each PHP request will create flame graph data, it is also recommended to set xdebug.trace_output_name to something that includes the full URL, such as:
xdebug.trace_output_name=xdebug-flame.%R
By default, flame graph data is written to the /tmp directory. You
can change that by using the xdebug.output_dir setting.
Don't forget to restart the web server or PHP-FPM after you make changes to PHP's configuration files.
Generate Flame Graph Data #
Like with Step Debugging or Function Trace, Xdebug needs to be triggered to generate flame graph data.
There are several ways of doing that, depending on the situation:
- Every Request
-
Set xdebug.start_with_request to
yes; this will result in a flame graph data file for every request. - Command Line Scripts
-
Set the
XDEBUG_TRACEenvironment variable to any value, or the configured xdebug.trigger_value. - Web Requests
-
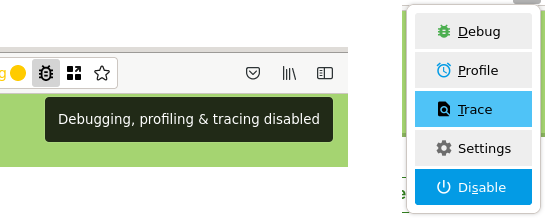
Install one of the browser extensions listed in the Step Debugging section, and then activate trace file generation by selecting the "Trace" option from its menu:
Create Flame Graph from Data #
First, clone the FlameGraph GIT repository:
cd ~/dev
git clone https://github.com/brendangregg/FlameGraph brendangreeg-FlameGraph
Then convert the file that Xdebug generated, adjusting paths where necesary:
zcat /tmp/xdebug-flame._docs_flamegraphs.xt.gz \
        | ~/dev/brendangreeg-FlameGraph/flamegraph.pl \
        > /tmp/flame-docs.svg
If xdebug.use_compression is set to off, or compression support has
not been enabled in Xdebug, then the file will not have the
.gz extension, and you should use cat instead of
zcat in the command above.
Display the Flame Graph
You can now open the generated SVG file in your browser, and
something like this will display:
The SVG is interactive. You can hover over a segment to see the full function name and the "length" of the segment. You can also select an element to zoom into that part of the graph, or search for function names.
The flamegraph.pl script has several configuration
options to tweak the appearance of the graph.
Related Settings and Functions #
- string xdebug.log =
- integer xdebug.log_level = 7
- string xdebug.mode = develop
- string xdebug.output_dir = /tmp
- string xdebug.start_with_request = default
- integer xdebug.trace_format = 0
- integer xdebug.trace_options = 0
- string xdebug.trace_output_name = trace.%c
- string xdebug.trigger_value = ""
- boolean xdebug.use_compression = true
- xdebug_get_tracefile_name() : mixed
- xdebug_info() : mixed
- xdebug_start_trace() : ?string
- xdebug_stop_trace() : false|string
Settings #
string xdebug.log = #
Configures Xdebug's log file.
Xdebug will log to this file all file creations issues, Step Debugging connection attempts, failures, and debug communication.
Enable this functionality by setting the value to a absolute path. Make sure
that the system user that PHP runs at (such as www-data if you are
running with Apache) can create and write to the file.
The file is opened in append-mode, and will therefore not be overwritten by default. There is no concurrency protection available.
The log file will include any attempt that Xdebug makes to connect to an IDE:
[2693358] Log opened at 2020-09-02 07:19:09.616195
[2693358] [Step Debug] INFO: Connecting to configured address/port: localhost:9003.
[2693358] [Step Debug] ERR: Could not connect to debugging client. Tried: localhost:9003 (through xdebug.client_host/xdebug.client_port).
[2693358] [Profiler] ERR: File '/foo/cachegrind.out.2693358' could not be opened.
[2693358] [Profiler] WARN: /foo: No such file or directory
[2693358] [Tracing] ERR: File '/foo/trace.1485761369' could not be opened.
[2693358] [Tracing] WARN: /foo: No such file or directory
[2693358] Log closed at 2020-09-02 07:19:09.617510
It includes the opening time (2020-09-02 07:19:09.616195), the
IP/Hostname and port Xdebug is trying to connect to
(localhost:9003), and whether it succeeded (Connected to
client). The number in brackets ([2693358]) is the
Process ID.
It includes:
[2693358]- process ID in brackets
2020-09-02 07:19:09.616195- opening time
For Step Debugging:
INFO: Connecting to configured address/port: localhost:9003.
ERR: Could not connect to debugging client. Tried: localhost:9003 (through xdebug.client_host/xdebug.client_port).
For Profiling:
ERR: File '/foo/cachegrind.out.2693358' could not be opened.
WARN: /foo: No such file or directory
For Function Trace and Flame Graphs:
ERR: File '/foo/trace.1485761369' could not be opened.
WARN: /foo: No such file or directory
All warnings and errors are described on the Description of errors page, with
detailed instructions on how to resolve the problem, if possible. All errors are always logged through
PHP's internal logging mechanism (configured with error_log
in php.ini). All warnings and errors also show up in the
diagnostics log that you can view by calling xdebug_info().
Step Debugger Communication
The debugging log can also log the communication between Xdebug and an IDE.
This communication is in XML, and starts with the <init XML
element:
<init
    xmlns="urn:debugger_protocol_v1" xmlns:xdebug="https://xdebug.org/dbgp/xdebug"
    fileuri="file:///home/httpd/www.xdebug.org/html/router.php"
    language="PHP" xdebug:language_version="7.4.11-dev"
    protocol_version="1.0" appid="2693358" idekey="XDEBUG_ECLIPSE">
        <engine version="3.0.0-dev"><![CDATA[Xdebug]]></engine>
        <author><![CDATA[Derick Rethans]]></author>
        <url><![CDATA[https://xdebug.org]]></url>
        <copyright><![CDATA[Copyright (c) 2002-2020 by Derick Rethans]]></copyright>
</init>
The fileuri attribute lists the entry point of your
application, which can be useful to compare to breakpoint_set
commands to see if path mappings are set-up correctly.
Beyond the <init element, you will find the configuration of
features:
<- feature_set -i 4 -n extended_properties -v 1
-> <response
       xmlns="urn:debugger_protocol_v1" xmlns:xdebug="https://xdebug.org/dbgp/xdebug"
       command="feature_set" transaction_id="4" feature="extended_properties" success="1">
   </response>
<- step_into -i 9
-> <response
       xmlns="urn:debugger_protocol_v1" xmlns:xdebug="https://xdebug.org/dbgp/xdebug"
       command="step_into" transaction_id="9"
       status="break" reason="ok">
           <xdebug:message filename="file:///home/httpd/www.xdebug.org/html/router.php" lineno="3">
           </xdebug:message>
   </response>
You can read about DBGP - A common debugger protocol specification at its dedicated documation page.
The xdebug.log_level setting controls how much information is logged.
Many Linux distributions now use systemd, which
implements private tmp directories. This means that when PHP
is run through a web server or as PHP-FPM, the /tmp directory is
prefixed with something akin to:
/tmp/systemd-private-ea3cfa882b4e478993e1994033fc5feb-apache.service-FfWZRg
This setting can additionally be configured through the
XDEBUG_CONFIG
environment variable.
integer xdebug.log_level = 7 #
Configures which logging messages should be added to the log file.
The log file is configured with the xdebug.log setting.
The following levels are supported:
| Level | Name | Example |
|---|---|---|
| 0 | Criticals | Errors in the configuration |
| 1 | Errors | Connection errors |
| 3 | Warnings | Connection warnings |
| 5 | Communication | Protocol messages |
| 7 | Information | Information while connecting |
| 10 | Debug | Breakpoint resolving information |
Criticals, errors, and warnings always show up in the diagnostics log that you can view by calling xdebug_info().
Criticals and errors are additionally logged through
PHP's internal logging mechanism (configured with error_log
in php.ini).
This setting can additionally be configured through the
XDEBUG_CONFIG
environment variable.
string xdebug.mode = develop #
This setting controls which Xdebug features are enabled.
This setting can only be set in php.ini or
files like 99-xdebug.ini that are read when a PHP process starts
(directly, or through php-fpm). You can not set this value in
.htaccess and .user.ini files, which are read
per-request, nor through php_admin_value as used in Apache VHOSTs
and PHP-FPM pools.
The following values are accepted:
off- Nothing is enabled. Xdebug does no work besides checking whether functionality is enabled. Use this setting if you want close to 0 overhead.
develop- Enables Development Helpers including the overloaded var_dump().
coverage- Enables Code Coverage Analysis to generate code coverage reports, mainly in combination with PHPUnit.
debug- Enables Step Debugging. This can be used to step through your code while it is running, and analyse values of variables.
gcstats- Enables Garbage Collection Statistics to collect statistics about PHP's Garbage Collection Mechanism.
profile- Enables Profiling, with which you can analyse performance bottlenecks with tools like KCacheGrind.
trace- Enables the Function Trace and Flame Graphs features.
- The former allows you record every function call, including arguments, variable assignment, and return value that is made during a request to a file.
- The latter can be used to visualise certain performance characteristics.
You can enable multiple modes at the same time by comma separating their
identifiers as value to xdebug.mode: xdebug.mode=develop,trace.
XDEBUG_MODE environment variable
You can also set Xdebug's mode by setting the XDEBUG_MODE
environment variable on the command-line; this will take precedence over the
xdebug.mode setting, but will not change the value of the xdebug.mode
setting.
Some web servers have a configuration option to
prevent environment variables from being propagated to PHP and Xdebug.
For example, PHP-FPM has a clear_env
configuration setting that is on by default, which you will
need to turn off if you want to use XDEBUG_MODE.
Make sure that your web server does not clean the environment, or specifically
allows the XDEBUG_MODE environment variable to be passed on.
string xdebug.output_dir = /tmp #
The directory where Xdebug will write tracing, profiling, and garbage collection statistics to. This directory needs to be writable for the system user with which PHP is running.
This setting can be changed in php.ini, .htaccess
(and equivalent files), and within a PHP file with ini_set().
In some cases (when profiling, or when
xdebug.start_with_request=yes with tracing), Xdebug
creates the file before the script runs. In that case, changes made through
ini_set() will not be taken into account.
This setting can additionally be configured through the
XDEBUG_CONFIG
environment variable.
Many Linux distributions now use systemd, which
implements private tmp directories. This means that when PHP
is run through a web server or as PHP-FPM, the /tmp directory is
prefixed with something akin to:
/tmp/systemd-private-ea3cfa882b4e478993e1994033fc5feb-apache.service-FfWZRg
string xdebug.start_with_request = default #
Step Debugging, a Function Trace, Flame Graphs, Garbage Collection Statistics, or Profiling can be activated at the start of a PHP request. Whether this happens depends on the value of this setting:
yes-
The functionality starts when the PHP request starts, and before any PHP code is run.
For example xdebug.mode=
traceand xdebug.start_with_request=yesstarts a Function Trace for the whole request. no-
The functionality does not get activated when the request starts.
You can still start a Function Trace with xdebug_start_trace(), or Garbage Collection Statistics with xdebug_start_gcstats().
Step Debugging and Profiling will never activate with this value.
trigger-
The functionality only gets activated when a specific trigger is present when the request starts.
The name of the trigger is
XDEBUG_TRIGGER, and Xdebug checks for its presence in either$_ENV(environment variable),$_GETor$_POSTvariable, or$_COOKIE(HTTP cookie name).There is a legacy fallback to a functionality specific trigger name:
XDEBUG_PROFILE(for Profiling),XDEBUG_TRACE(for a Function Trace or Flame Graphs), andXDEBUG_SESSION(for Step Debugging).There is another legacy trigger for Step Debugging only. If you set the
XDEBUG_CONFIGenvironment variable to any value, then the step debugger will also get activated.Debug session management for Step Debugging is also available through
XDEBUG_SESSION_START.With xdebug.trigger_value you can control which specific trigger value will activate the trigger. If xdebug.trigger_value is set to an empty string, any value will be accepted.
In this mode it is also possible to activate Step Debugging with xdebug_break().
default-
The
defaultvalue depends on xdebug.mode:- debug:
trigger - gcstats:
no - profile:
yes - trace:
trigger
- debug:
integer xdebug.trace_format = 0 #
The format of the trace file.
| Value | Description |
|---|---|
| 0 | shows a human readable indented trace file with: time index, memory usage, memory delta, level, function name, function parameters, filename and line number. |
| 1 | writes a computer readable format which has two different records. There are different records for entering a stack frame, and leaving a stack frame. The table below lists the fields in each type of record. Fields are tab separated. |
| 2 | writes a trace formatted in (simple) HTML. |
| 3 | writes a "cost" flame graph. See the documentation on Flame Graphs for more information. |
| 4 | writes a "memory usage" flame graph. See the documentation on Flame Graphs for more information. |
Fields for the computerized format, depend on the record type.
Entry Line
| Field | Description |
|---|---|
| 1 | level |
| 2 | function # |
| 3 | always '0' |
| 4 | time index |
| 5 | memory usage |
| 6 | function name |
| 7 | user-defined (1) or internal function (0) |
| 8 | name of the include or require file |
| 9 | filename |
| 10 | line number |
| 11 | no. of arguments |
| 12.. | arguments (as many as specified in field 11) — tab separated |
Exit Line
| Field | Description |
|---|---|
| 1 | level |
| 2 | function # |
| 3 | always '1' |
| 4 | time index |
| 5 | memory usage |
Return Line
| Field | Description |
|---|---|
| 1 | level |
| 2 | function # |
| 3 | always 'R' |
| 4 | empty |
| 5 | empty |
| 6 | return value |
See the introduction for Function Trace for a few examples.
integer xdebug.trace_options = 0 #
This settings accepts a bitfield to enable options:
- 0x01
- Trace file data will be appended to an already existing file with the same name, instead of it being overwritten.
- 0x02
- Switches the file format to a tab separated format. The format is described in the xdebug.trace_format setting as "format 1".
- 0x04
- Switches to a file format that shows data as an HTML table
- 0x08
- With this bit set,
.xtis not added automatically to the end of trace file names. - 0x10
- Switches to a file format that provides information for "cost" flamegraphs.
- 0x20
- Switches to a file format that provides information for "memory usage" flamegraphs.
To combine multiple flags, you can use bitwise-OR (|).
xdebug.trace_options=0x02|0x08 enables both the tab separated format,
and stops the addition of .xt to the end of the file name.
string xdebug.trace_output_name = trace.%c #
This setting determines the name of the file that is used to dump traces into. The setting specifies the format with format specifiers, very similar to sprintf() and strftime(). There are several format specifiers that can be used to format the file name. The '.xt' extension is always added automatically.
The possible format specifiers are:
| Specifier | Meaning | Example Format | Example Filename |
|---|---|---|---|
| %c | crc32 of the current working directory | trace.%c | trace.1258863198.xt |
| %p | pid | trace.%p | trace.5174.xt |
| %r | random number | trace.%r | trace.072db0.xt |
| %s | script name 2 | cachegrind.out.%s | cachegrind.out._home_httpd_html_test_xdebug_test_php |
| %t | timestamp (seconds) | trace.%t | trace.1179434742.xt |
| %u | timestamp (microseconds) | trace.%u | trace.1179434749_642382.xt |
| %H | $_SERVER['HTTP_HOST'] | trace.%H | trace.kossu.xt |
| %R | $_SERVER['REQUEST_URI'] | trace.%R | trace._test_xdebug_test_php_var=1_var2=2.xt |
| %U | $_SERVER['UNIQUE_ID'] 3 | trace.%U | trace.TRX4n38AAAEAAB9gBFkAAAAB.xt |
| %S | session_id (from $_COOKIE if set) | trace.%S | trace.c70c1ec2375af58f74b390bbdd2a679d.xt |
| %% | literal % | trace.%% | trace.%%.xt |
2 This one is only available for trace file names since Xdebug 2.6.
3 New in version 2.2. This one is set by Apache's mod_unique_id module
string xdebug.trigger_value = "" #
This setting can be used when xdebug.start_with_request is set to
trigger, which is the default for Step Debugging and Function Trace.
In trigger mode, Xdebug will only start its
functionality when the XDEBUG_TRIGGER is set in the environment,
or when the XDEBUG_TRIGGER GET, POST, or COOKIE variable is
set.
The legacy names XDEBUG_SESSION (for Step Debugging),
XDEBUG_PROFILE (for Profiling), and XDEBUG_TRACE
(for Function Trace) can also be used instead of XDEBUG_TRIGGER.
Normally, Xdebug does not look at which value is actually used. If this setting is set to a non-empty string, then Xdebug will only trigger if the value matches the value of this setting.
With the following settings:
xdebug.mode=profile
xdebug.start_with_request=trigger
xdebug.trigger_value=StartProfileForMe
Xdebug's profiler will only start when either the environment variable
XDEBUG_TRIGGER is set to StartProfileForMe, the GET
or POST variable XDEBUG_TRIGGER is set to
StartProfileForMe, or when the cookie XDEBUG_TRIGGER
has the value StartProfileForMe.
From Xdebug 3.1, it is possible to configure multiple values by using a comma separated list. In that case, Xdebug will trigger if the supplied value matches any of the entries that are configured through this setting:
xdebug.trigger_value=StartDebuggerForMe,StartDebuggerForYou
See also:
- xdebug.start_with_request#trigger
- For how the triggering mechanism works, and which environment and server variables Xdebug acts on.
boolean xdebug.use_compression = true #
Introduced in Xdebug >= 3.1
If enabled, the Function Trace and Profiling features will create GZip compressed files as output. This reduces diskspace.
If GZip compression is not supported by Xdebug, because it was not compiled in, then Xdebug will add a warning to its log and xdebug_info() diagnostics section.
It is enabled by default if Xdebug has GZip support, and disable if Xdebug does not have GZip support.
The QCacheGrind tool that you can use to visualise profiling information
does not support reading GZip compressed profile files, whereas KCacheGrind and
PhpStorm do. If you are a QCacheGrind user, you should set
xdebug.use_compression to false.
Functions #
xdebug_get_tracefile_name() : mixed #
Returns the name of the function trace file
Returns the name of the file which is used to trace the output of this
script to, or null if tracing is not active. This is useful when
the trace was started automatically because xdebug.start_with_request was set to
yes.
xdebug_info( string $category = null ) : mixed #
Show and retrieve diagnostic information
This function presents APIs to retrieve information about Xdebug itself. Which information gets returned, or displayed, depends on which arguments, or none at all, are given.
$category =
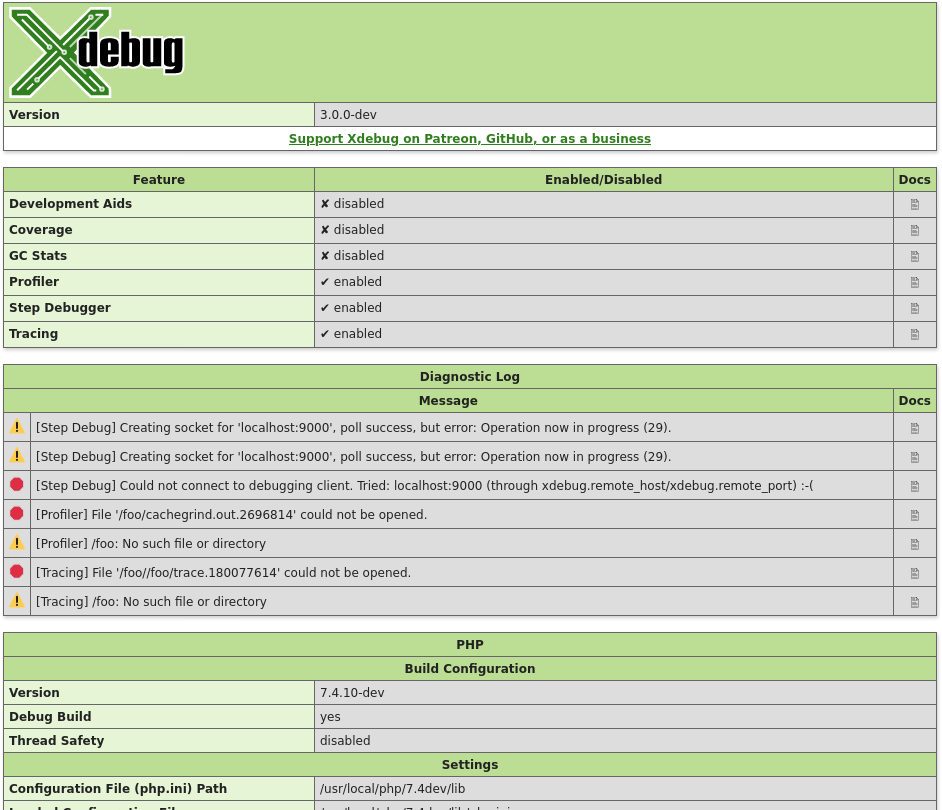
Without arguments, this function returns an HTML page which shows diagnostic information. It is analogous to PHP's phpinfo() function.
The HTML output includes which mode is active, what the settings are, and diagnostic information in case there are problems with debugging connections, opening of files, etc.
Each warning and error in the diagnostics log also links through to the Description of errors documentation page.
$category = 'mode' (New in Xdebug 3.1)
The function returns an array of all the
enabled modes, whether through xdebug.mode or the
XDEBUG_MODE environment variable.
Example:
<?php
var_dump( xdebug_info( 'mode' ) );
?>
Returns:
array(3) {
  [0] =>
  string(5) "debug"
  [1] =>
  string(7) "develop"
  [2] =>
  string(5) "trace"
}
$category = 'extension-flags' (New in Xdebug 3.1)
The function returns an array of all the compile flags that were enabled when
running ./configure as part of Xdebug's compilation process, and
all the system-specific detected features that effect Xdebug's behaviour.
If the compression flag is enabled, then the xdebug.use_compression
setting is available, and enabled by default.
Profiling and Function Trace will create GZip compressed files if the xdebug.use_compression setting is turned on (the default).
If the control-socket and tsc elements are present,
then Xdebug can be controlled with the Xdebug Control tool, as long as
xdebug.control_socket is not set to "off".
If the control-socket flag is present, but the tsc
flag is not present, then you must set xdebug.control_socket to
"time" deliberately for Xdebug Control to be able to interact
with Xdebug.
Example:
<?php
var_dump( xdebug_info( 'extension-flags' ) );
?>
Returns:
array(1) {
  [0] =>
  string(11) "compression"
  [1] =>
  string(14) "control-socket"
  [2] =>
  string(3) "tsc"
}
xdebug_start_trace( ?string $traceFile = null, int $options = 0 ) : ?string #
Starts a new function trace
Start tracing function calls from this point to the file in the
$trace_file parameter. If no filename is given, then the trace file will
be placed in the directory as configured by the xdebug.output_dir setting.
In case a file name is given as first parameter, the name is relative to the current working directory. This current working directory might be different than you expect it to be, so please use an absolute path in case you specify a file name. Use the PHP function getcwd() to figure out what the current working directory is.
The name of the trace file is {$trace_file}.xt. If the trace was started at
the beginning of the request because xdebug.start_with_request is set to
yes, then the filename depends on the
xdebug.trace_output_name setting.
The options parameter is a bitfield; currently there are four options:
- XDEBUG_TRACE_APPEND (0x01)
- Trace file data will be appended to an already existing file with the same name, instead of it being overwritten.
- XDEBUG_TRACE_COMPUTERIZED (0x02)
- Switches the file format to the tab separated format. The format is described in the xdebug.trace_format setting as "format 1".
- XDEBUG_TRACE_HTML (0x04)
- Switches to a file format that shows data as an HTML table.
- XDEBUG_TRACE_NAKED_FILENAME (0x08)
- With the XDEBUG_TRACE_NAKED_FILENAME flag set,
.xtis not added automatically to the end of trace file names. - XDEBUG_TRACE_FLAMEGRAPH_COST (0x10)
- Switches to a file format that contains data to create a flame graph visualing CPU time.
- XDEBUG_TRACE_FLAMEGRAPH_MEM (0x20)
- Switches to a file format that contains data to create a flame graph visualing memory usage.
The XDEBUG_TRACE_FLAMEGRAPH_COST and
XDEBUG_TRACE_FLAMEGRAPH_MEM flags are used to create flame graph
data. Flame Graphs are described separately.
Example:
<?php
xdebug_start_trace("/tmp/xdebug.trace", XDEBUG_TRACE_COMPUTERIZED|XDEBUG_TRACE_NAKED_FILENAME);
?>
The line above creates a file named /tmp/xdebug.trace.
It does not add .xt to the end of the filename (due to
XDEBUG_TRACE_NAKED_FILENAME).
The tab-separated trace file format is used due to
XDEBUG_TRACE_COMPUTERIZED.
The settings xdebug.collect_assignments, xdebug.collect_params, and xdebug.collect_return influence what information is logged to the trace file and the setting xdebug.trace_format influences the format of the trace file.
The full path and filename to which Xdebug traces is returned from this
function. This will be either the filename you pass in (potentially with
.xt added), or the auto generated filename if no filename has been
passed in.
xdebug_stop_trace() : false|string #
Stops the current function trace
Stop tracing function calls and closes the trace file.
The function returns the filename of the file where the trace was written to.